
Kubernetes Monitoring with Grafana: A Practical Guide
Learn how to effectively use Grafana for Kubernetes monitoring with this practical guide. Explore setup, configuration, and best practices for optimal performance.
Kubernetes has become the de facto standard for container orchestration, but managing and monitoring complex deployments can be challenging. Comprehensive visibility into your cluster's performance is crucial for ensuring application stability and efficient resource utilization. Grafana addresses this. This guide offers a practical, step-by-step approach to using Grafana for Kubernetes monitoring. By the end, you'll be ready to create and manage Kubernetes monitoring tailored to your needs, ensuring your environment's health, performance, and stability.
For teams managing multiple clusters and complex Kubernetes environments at scale, we'll specifically highlight how Plural's unified Kubernetes dashboard streamlines operations by consolidating resource monitoring, log viewing, and management functions into a single unified interface that's particularly effective for large-scale Kubernetes deployments.
Unified Cloud Orchestration for Kubernetes
Manage Kubernetes at scale through a single, enterprise-ready platform.
Key Takeaways
- Visualize Kubernetes data with Grafana: Create insightful dashboards to monitor cluster health, application performance, and resource usage, integrating data from Prometheus, Loki, and other sources.
- Streamline Grafana management with best practices: Implement robust security measures, organize dashboards effectively, and optimize queries to monitor large-scale deployments efficiently.
- Extend Grafana's power with advanced integrations: Leverage Helm and GitOps for automated deployments and configuration, and explore features like custom plugins, multi-cluster monitoring, and anomaly detection.
What is Grafana's Role in Kubernetes Monitoring?
Grafana plays a crucial role in Kubernetes monitoring by providing a powerful and flexible platform to visualize and analyze the performance of your applications and infrastructure. It acts as a centralized dashboard, aggregating metrics from various sources and presenting them in a clear, understandable format. This lets you quickly identify issues, understand trends, and optimize your Kubernetes deployments.
What is Grafana, and what are its key features?
Grafana is an open-source visualization and analytics tool. It's lightweight and supports many data sources, including Prometheus, AWS CloudWatch, and Stackdriver. Key features include customizable dashboards, alerting, data source plugins, and a vibrant community providing support and extensions. This flexibility makes Grafana a versatile tool for monitoring diverse environments, including complex Kubernetes setups.
How does Grafana integrate with Kubernetes?
Grafana seamlessly integrates with Kubernetes through tools like Prometheus, which is commonly used for collecting Kubernetes metrics. The integration process typically involves deploying Grafana within your Kubernetes cluster and configuring it to connect to your Prometheus instance. Once connected, Grafana can query Prometheus for metrics and display them in interactive dashboards. This setup leverages the scalability and performance of both Prometheus and Grafana, providing a robust monitoring solution.
Why use Grafana for complex Kubernetes environments?
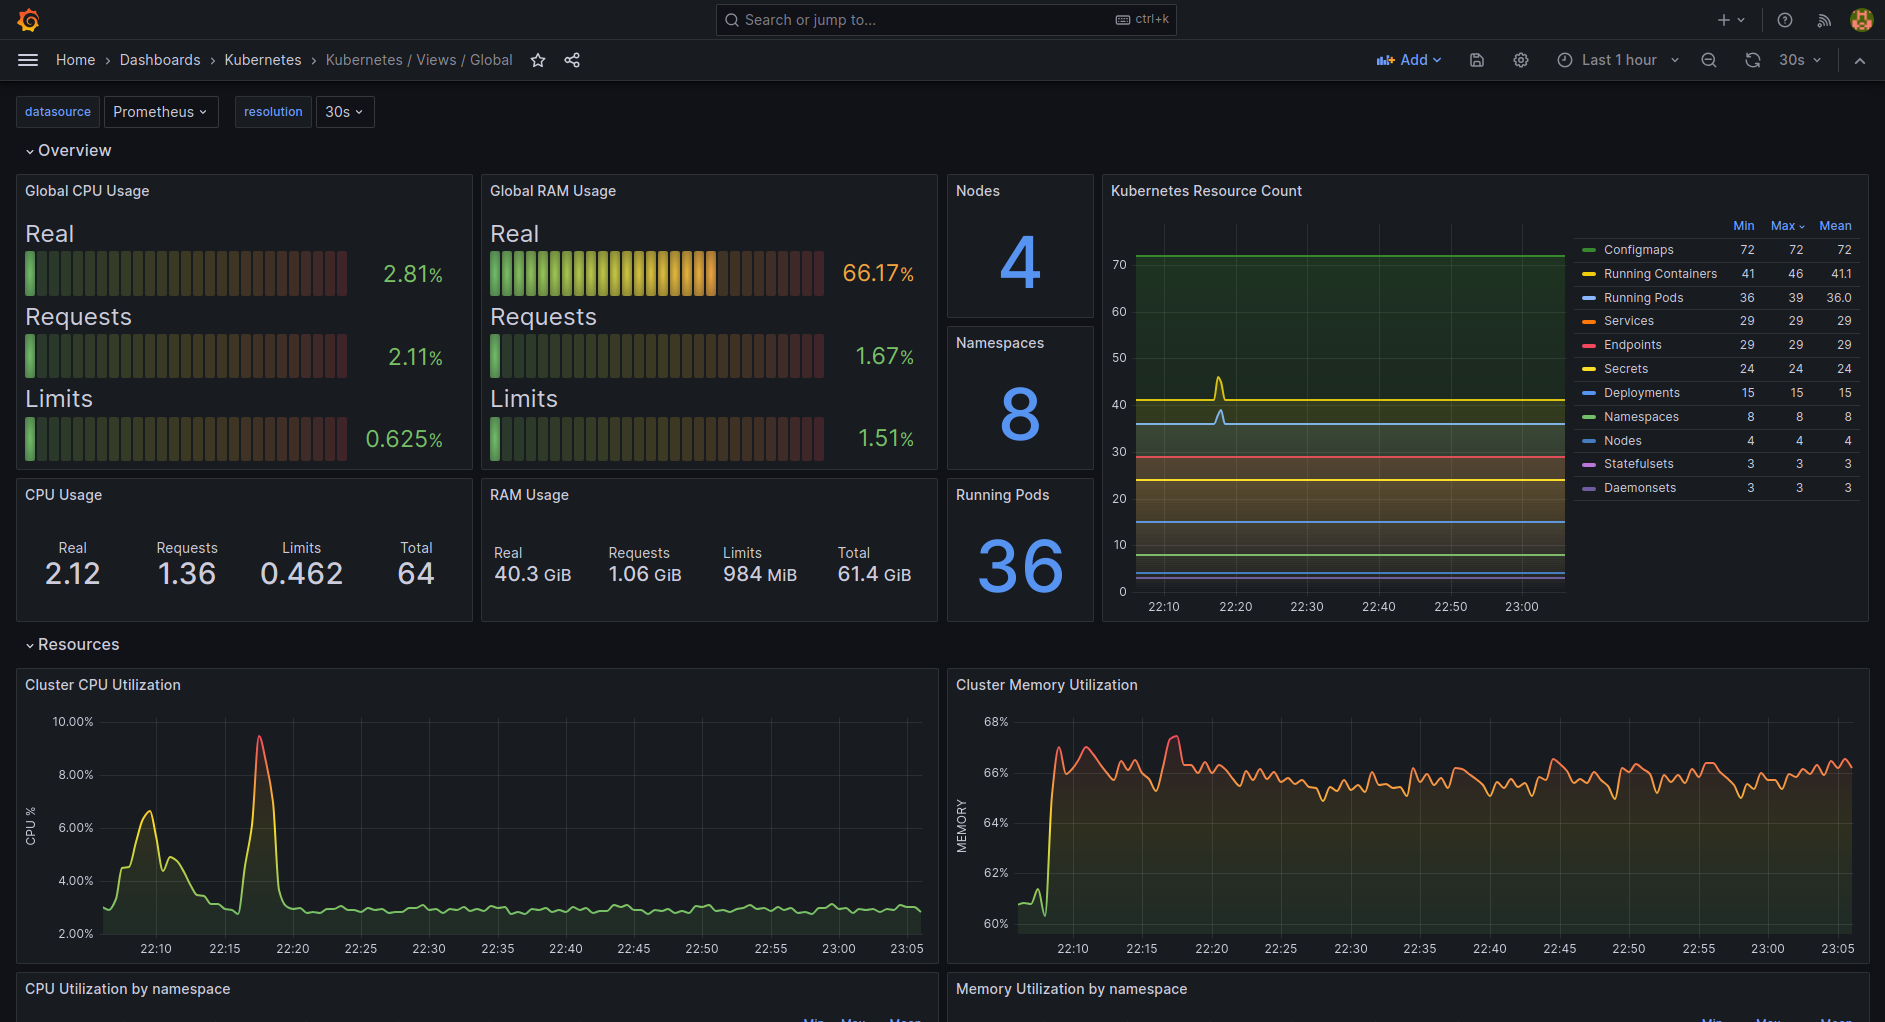
Grafana is particularly well-suited for complex Kubernetes environments because it provides comprehensive visibility into your cluster. You can monitor everything from cluster-level resource usage down to individual container performance. Grafana's customizable dashboards and visualizations make it easy to spot performance bottlenecks, resource constraints, and other potential issues. Furthermore, you can use community-built pre-built dashboards and alerts specifically designed for Kubernetes, simplifying your monitoring system's initial setup and ongoing maintenance.
Install and Configure Grafana on Kubernetes
This section provides a practical guide to installing and configuring Grafana on your Kubernetes cluster for effective monitoring.
Prepare for Grafana deployment
Before you begin, ensure your Kubernetes cluster is up and running. You can use a local Kubernetes distribution like Minikube for testing, or managed cloud services such as Google Kubernetes Engine (GKE), Amazon EKS, or Azure AKS for production deployments. Grafana’s system requirements are relatively low: 1 GB of disk space, 750 MB of memory, and 0.25 CPU cores are sufficient for basic operation. For production environments with a heavy load, consider allocating more resources.
Install Grafana: A step-by-step guide
The installation typically involves creating a Persistent Volume Claim (PVC) for persistent storage, a Deployment to manage the Grafana pods, and a Service to expose Grafana. Using Helm simplifies this process significantly.
helm install --namespace <NAMESPACE> <RELEASE_NAME> grafana/grafana
This command installs the latest version of Grafana. For specific versions or alternative distributions like Grafana Alloy, refer to the official Grafana Helm chart documentation.
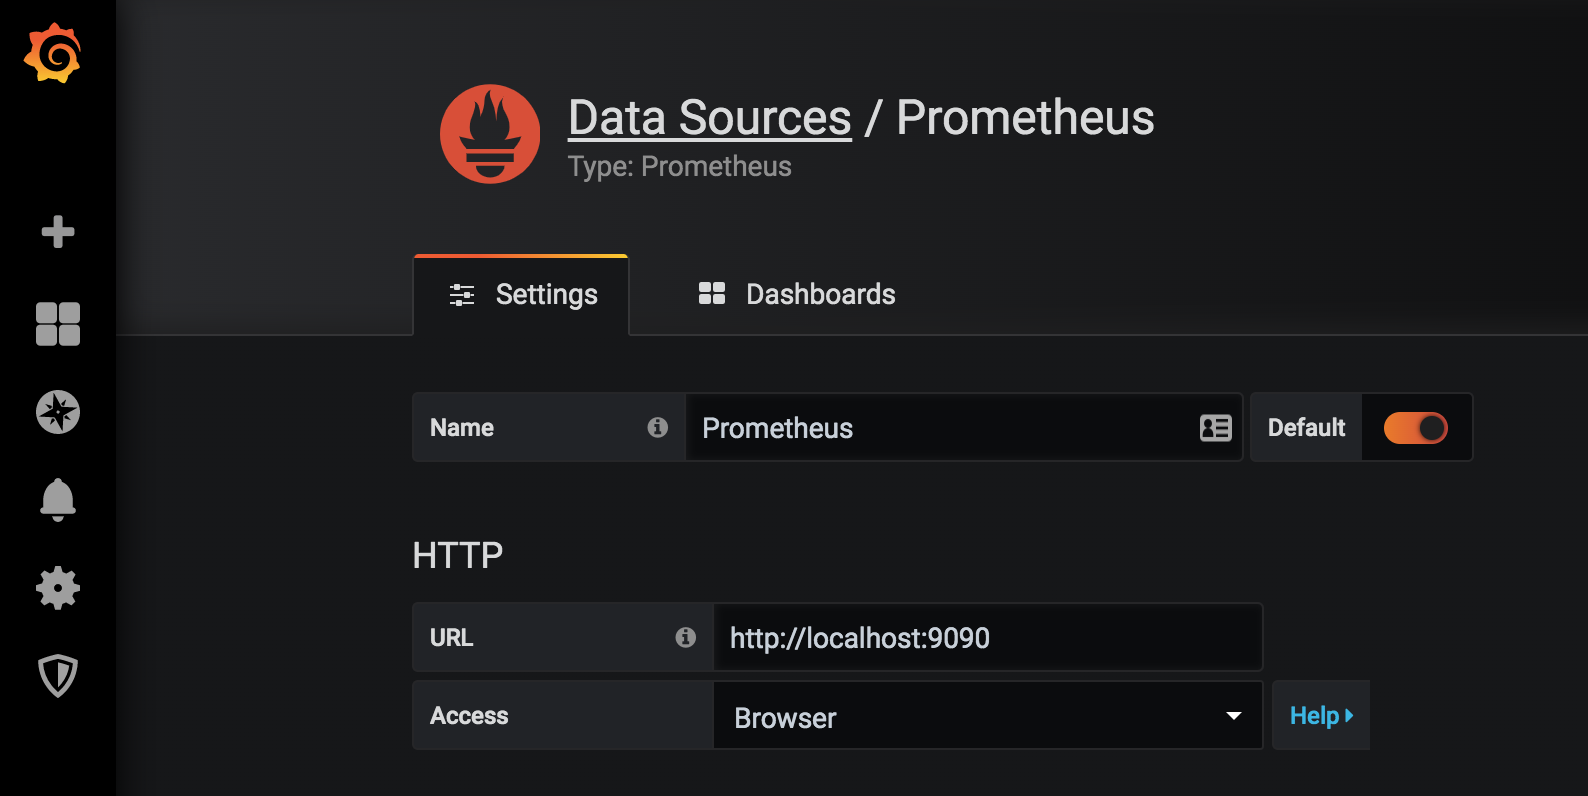
Configure Grafana and set up data sources
After successful installation, configure Grafana to connect to your data sources. A common practice is to use YAML files to define these configurations. Create a grafana-datasource-config.yaml file to define your data source, such as Prometheus, a popular choice for monitoring Kubernetes. An example configuration for a Prometheus data source would look like this:
apiVersion: 1
datasources:
  - name: Prometheus
    type: prometheus
    url: http://prometheus-server.monitoring.svc.cluster.local
    access: proxy
    isDefault: true
Apply this configuration using kubectl apply -f grafana-datasource-config.yaml. Refer to the Grafana documentation for more details on configuring various data sources.
Troubleshoot common installation challenges
Encountering issues during installation is normal. Start by examining the logs of the Grafana pod using kubectl logs. Increase log verbosity for more detailed information. You can adjust Grafana's configuration using ConfigMaps. The Grafana documentation provides comprehensive guidance on troubleshooting. If you're still facing problems, community forums and support channels can offer further assistance.
Grafana Best Practices for Kubernetes
This section covers best practices for running Grafana on Kubernetes, focusing on resource management, security, dashboard organization, and performance optimization.
Manage resources and scale Grafana
Efficient resource management is key for Grafana's stability and responsiveness. While Grafana's minimum requirements are modest, monitor resource usage as your dashboards and queries become more complex. Adjust resource requests and limits in your Deployment configuration to prevent performance degradation or pod instability. Consider using the Horizontal Pod Autoscaler (HPA) to automatically scale Grafana instances based on CPU or memory consumption, ensuring high availability during peak loads.
Secure Grafana and control access
Securing your Grafana instance is crucial. Access methods depend on your Kubernetes setup. Immediately change the default admin credentials upon installation. Enable authentication and authorization using a supported method, such as OAuth or an identity provider, to restrict access. Isolating Grafana in a dedicated Kubernetes namespace enhances security by limiting the blast radius of potential vulnerabilities. Network policies further restrict access to Grafana, allowing only authorized traffic.
Organize dashboards for effective monitoring
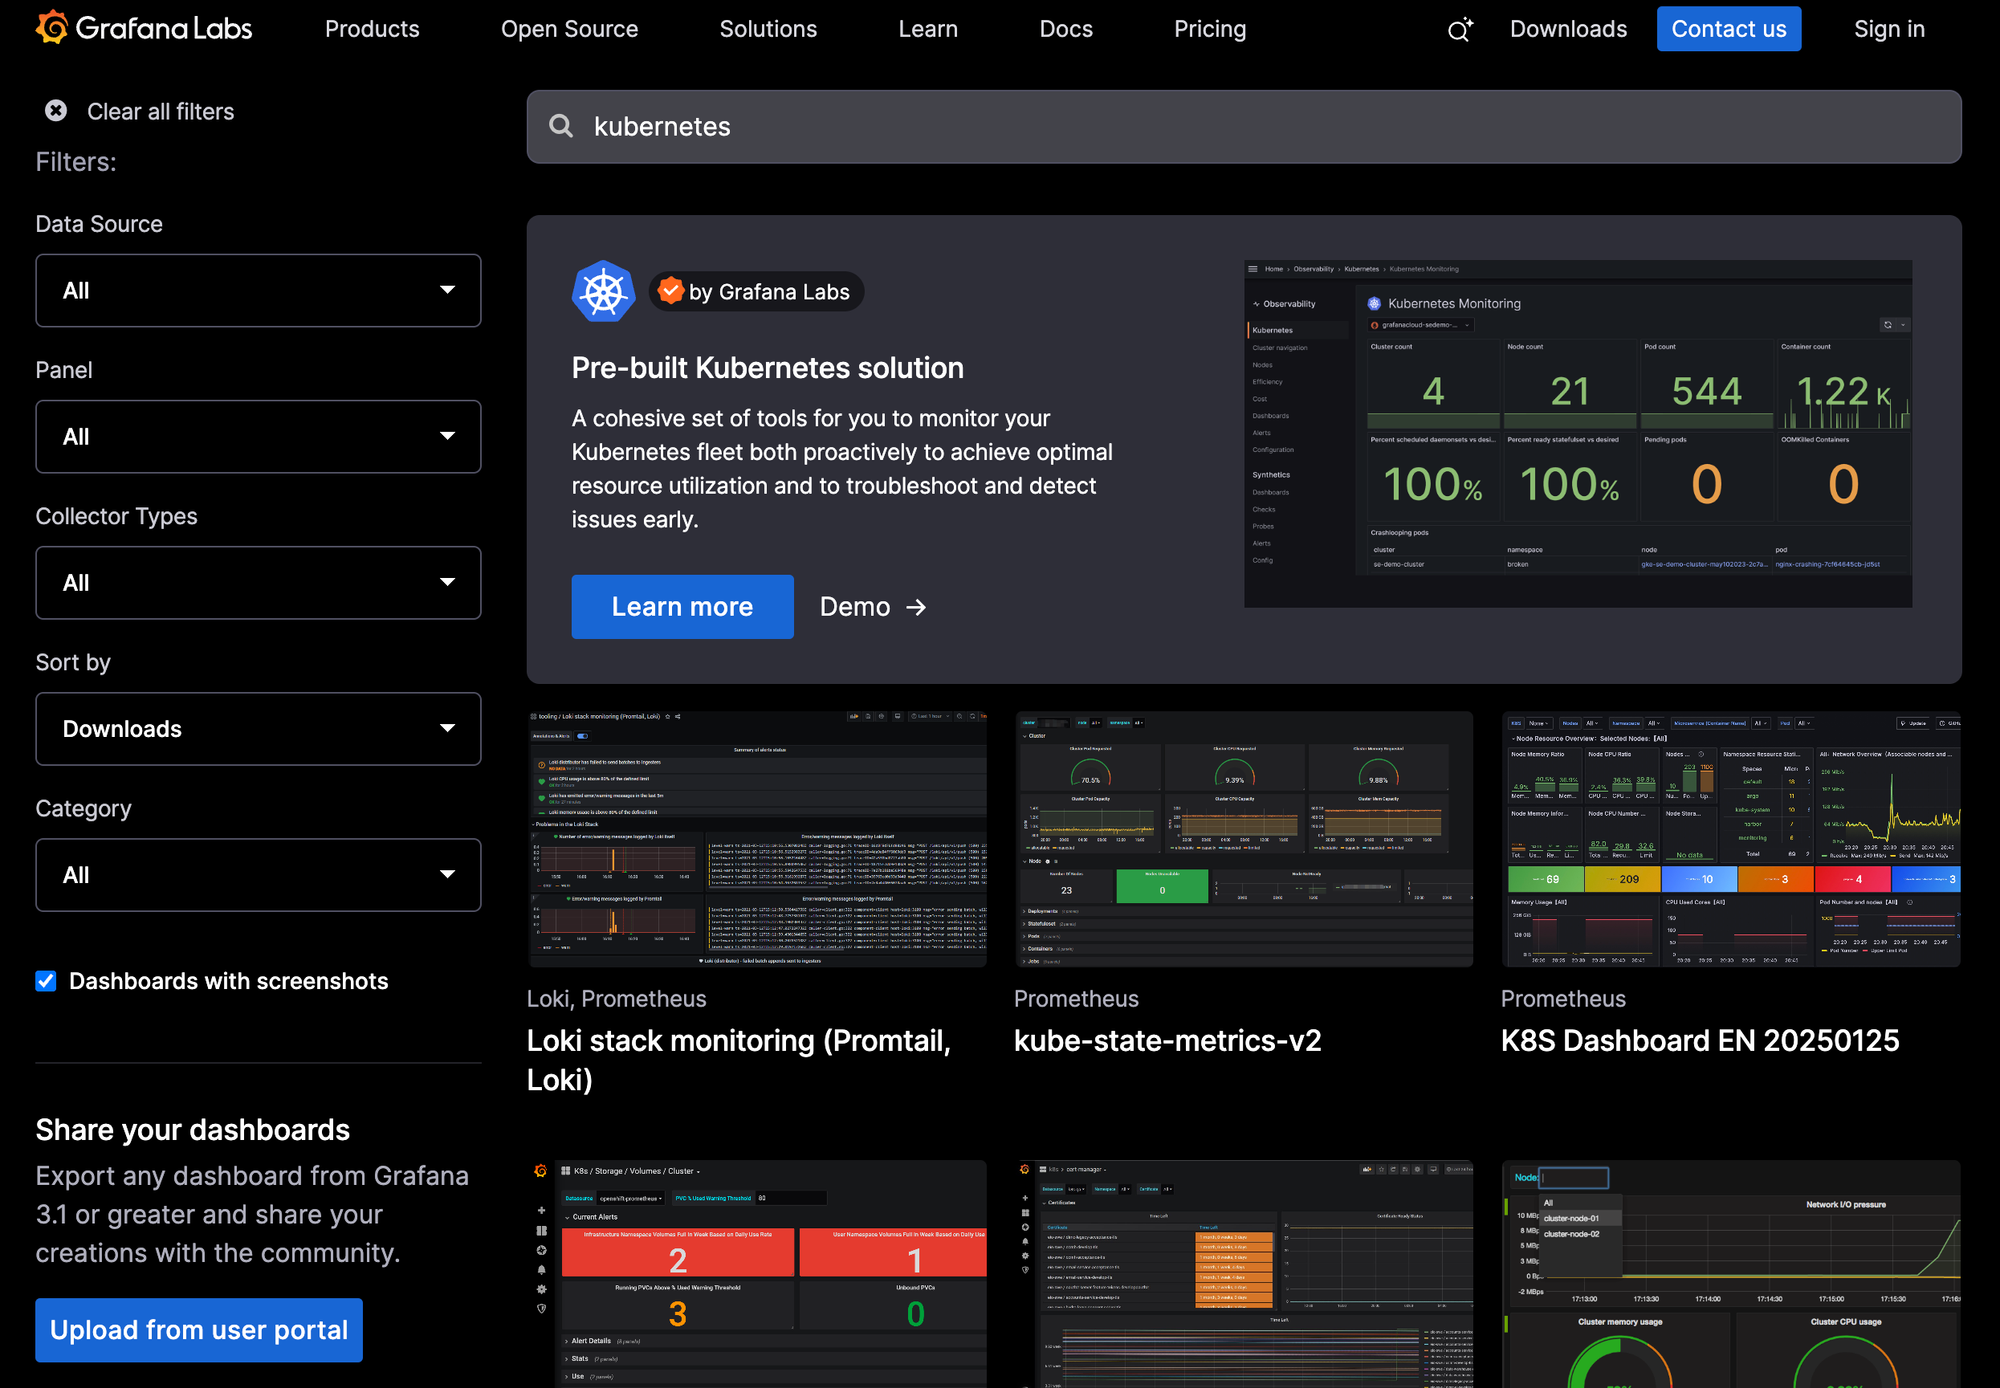
Well-organized dashboards are essential for precise and efficient Kubernetes monitoring. Leverage Grafana's provisioning feature to define dashboards, data sources, and plugins through configuration files. This enables version control and simplifies management. Explore pre-built dashboards for Kubernetes, often available via template IDs, for common metrics. Group related dashboards into folders to maintain a structured overview. Use consistent naming conventions and tagging to search and filter dashboards easily. Document your dashboards to ensure clarity.
Optimize Grafana performance
Performance optimization ensures Grafana remains responsive even under heavy load. Implement rolling updates for Grafana deployments to minimize downtime during upgrades. Kubernetes rolling updates allow new pods to be deployed gradually, replacing older pods only after they become healthy. This ensures continuous availability. Regularly monitor Grafana logs for errors or performance issues. Increase the log level to debug for more detailed information when troubleshooting. Optimize your queries to reduce the load on your data sources. Use Grafana's query caching mechanisms to avoid redundant queries.
Visualize Kubernetes Metrics and Logs
After installing and configuring Grafana, the next step is visualizing your Kubernetes metrics and logs. This section outlines how to set up data sources, create effective dashboards, and analyze logs to gain valuable insights into your cluster's performance.
Set up data sources for Kubernetes metrics
Grafana seamlessly integrates with various data sources, including Prometheus, a popular choice for Kubernetes monitoring. Ensure your Prometheus instance is correctly configured and scraping metrics from your Kubernetes cluster. Within Grafana, add Prometheus as a data source, providing the necessary connection details. This establishes the pipeline for metrics to flow into your dashboard. For other data sources, consult Grafana's documentation for setup instructions.
Create effective dashboards
Grafana's user-friendly interface makes creating informative dashboards straightforward. Leveraging pre-built templates accelerates dashboard creation. Grafana provides a library of community-shared Kubernetes dashboard templates as a solid starting point. This curated approach helps avoid data overload and ensures you're focusing on the most critical aspects of your cluster's health.
Analyze and visualize Kubernetes logs
Beyond metrics, analyzing logs is crucial for comprehensive Kubernetes monitoring. Grafana Loki, tightly integrated with Grafana, provides a powerful log aggregation and analysis solution. You can easily correlate Kubernetes metrics from Prometheus with logs from Loki within Grafana, simplifying troubleshooting.
Enhance Kubernetes Observability
Once you’ve set up Grafana and created dashboards, you can enhance your observability setup with advanced features. These features will help you proactively monitor your cluster, adapt to changing conditions, and integrate with your existing monitoring tools.
Set up alerts and notifications
Setting up alerts is crucial for proactive monitoring. You want to know about problems before they impact your users. Grafana allows you to define alert rules based on metrics and logs. For example, you can create alerts for high CPU usage, low disk space, or increasing error rates. Configure notifications to receive alerts via email, Slack, PagerDuty, or other channels. This ensures you’re immediately informed of critical issues and can take action quickly.
Use Grafana variables for dynamic dashboards
Grafana variables enable you to create dynamic and reusable dashboards. Instead of creating separate dashboards for each application or environment, you can use variables to filter and display data based on selected criteria. For example, you could make a variable for the namespace and use it to filter the metrics displayed on the dashboard.
Implement custom plugins and data sources
Grafana supports many plugins and data sources, extending its functionality beyond basic Kubernetes monitoring. You can integrate with various monitoring tools, databases, and cloud providers. For example, you might want to visualize data from your cloud provider's monitoring service or integrate with a specialized logging platform. You can tailor Grafana to your specific monitoring needs by provisioning and customizing data sources and plugins using configuration files.
Troubleshoot and Maintain Grafana
After setting up Grafana, ongoing maintenance and troubleshooting are crucial for reliable monitoring. This section covers common issues and best practices to keep your Grafana instance running smoothly.
Resolve Grafana-Kubernetes Integration Issues
Integration problems between Grafana and Kubernetes often stem from misconfigurations. Start by examining Grafana's logs for detailed error messages. Increase the log level to debug for more granular insights. Leverage ConfigMaps to manage Grafana's configuration externally. This allows you to dynamically adjust settings without redeploying the entire Grafana instance, simplifying troubleshooting and configuration changes. For example, you can store your Grafana data source configurations in a ConfigMap and mount them into the Grafana pod. This makes managing data sources easier and more flexible.
Debug Grafana Performance Problems
If you encounter performance issues, ensure your resource allocation (CPU and memory) is sufficient for your workload. Monitor resource usage metrics within Grafana or using Kubernetes tools like kubectl top. Consider using the Kubernetes Horizontal Pod Autoscaler (HPA) to automatically adjust the number of Grafana pods based on resource utilization.
Maintain and Update Grafana in Production
Employ rolling updates for seamless Grafana upgrades in production. This minimizes downtime by incrementally updating pods. Implement a rollback strategy in case of unexpected problems. This could involve maintaining previous versions of your Grafana deployment YAML files in a Git repository, enabling quick reversion to a known working state. Regularly back up your Grafana data to prevent data loss in case of failures.
Automate Grafana Management
Automating Grafana management simplifies deployment, configuration, and updates, ensuring your monitoring system remains reliable and efficient.
Deploy Grafana with Helm
Helm simplifies Kubernetes deployments by packaging applications into charts. Deploying Grafana using Helm involves a few straightforward steps: adding the Grafana chart repository, updating the repository, creating a namespace (optional, but recommended), and installing the chart. This process ensures a consistent and repeatable deployment, reducing manual configuration and potential errors.

Manage Grafana configurations with GitOps
GitOps brings the benefits of version control to infrastructure management. By storing your Grafana dashboards and data source configurations as YAML files in a Git repository, you gain a clear history of changes, simplifying rollbacks and collaboration. This approach ensures configuration consistency across environments and allows for automated deployments triggered by Git commits. Tools like Argo CD and Flux can automate the synchronization of your Git repository with your Kubernetes cluster, ensuring your Grafana setup remains consistent with your desired state.
Update and manage Grafana versions
Keeping Grafana updated is crucial for both security and accessing new features. Kubernetes facilitates updates through rolling updates and rollbacks. Rolling updates allow you to deploy new versions of Grafana with minimal downtime, ensuring continuous monitoring. If issues arise after an update, rollbacks provide a quick way to revert to a previous stable version. Helm simplifies this process further by managing Grafana upgrades through chart versions. You can specify the desired version in your Helm command, and Helm handles the update process, including managing dependencies.
Large-scale Kubernetes Monitoring with Plural
While open-source tools like Prometheus and Grafana provide a solid foundation for Kubernetes monitoring, managing them at scale across a fleet of Kubernetes clusters quickly adds complexity. Kubernetes monitoring isn't a one-size-fits-all solution. It involves tracking various metrics and using different tools to collect and analyze data. To get a complete picture of your environment, you need to understand the multiple levels of your infrastructure—from individual containers to the nodes and the cluster as a whole.
This is where a Kubernetes management platform like Plural shines. Plural integrates these tools and enhances them with features designed for managing and monitoring large-scale Kubernetes deployments.
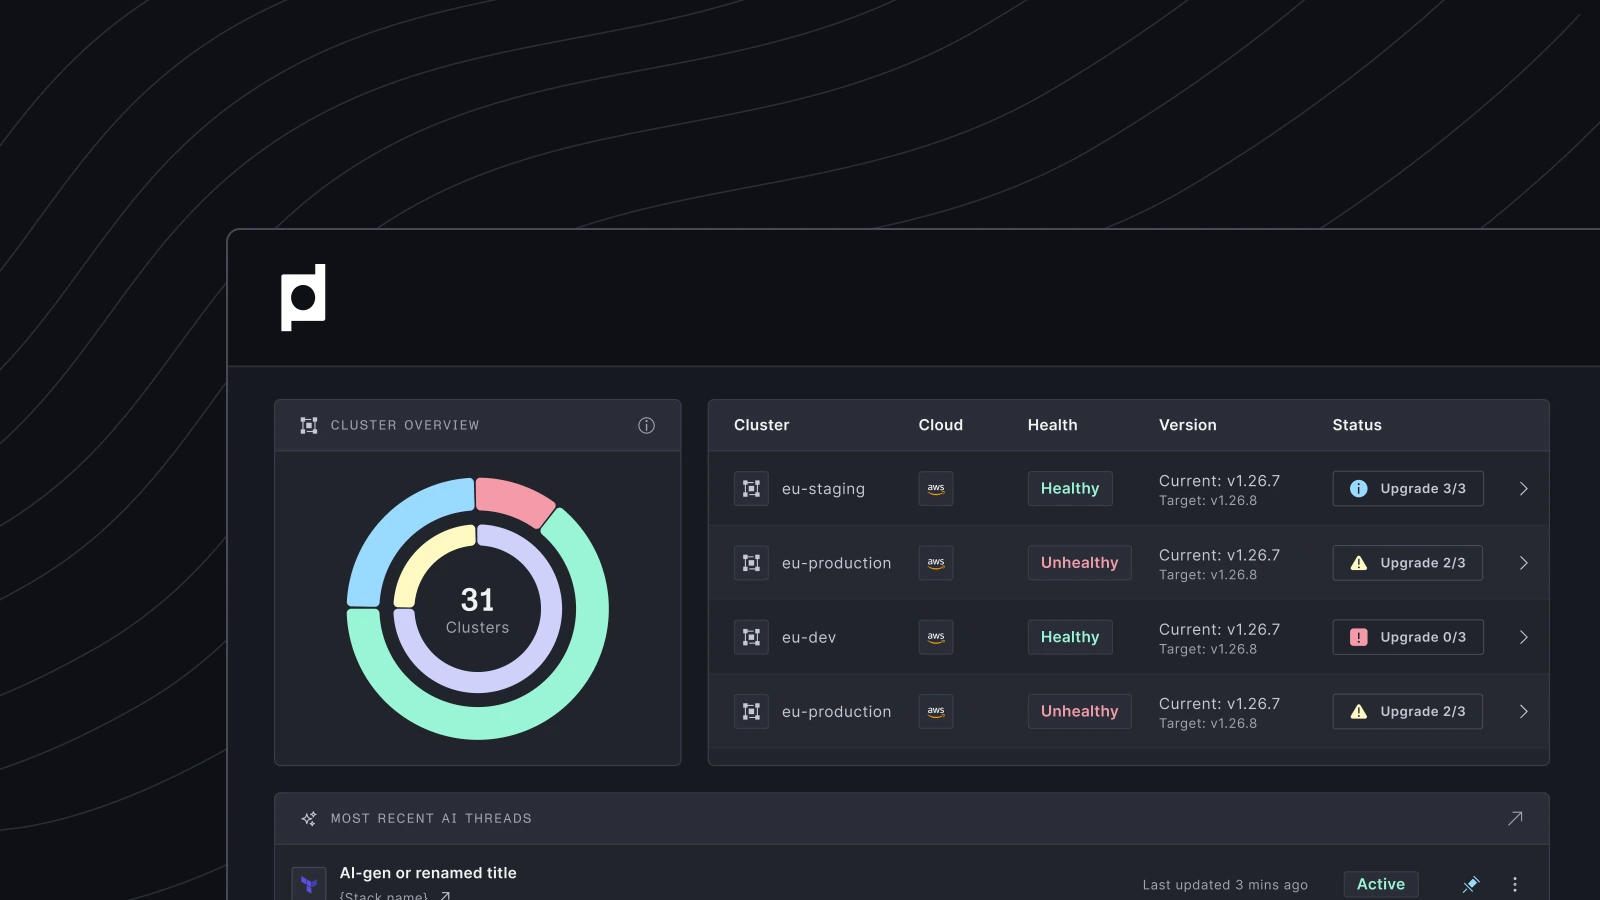
Unified Kubernetes Dashboard
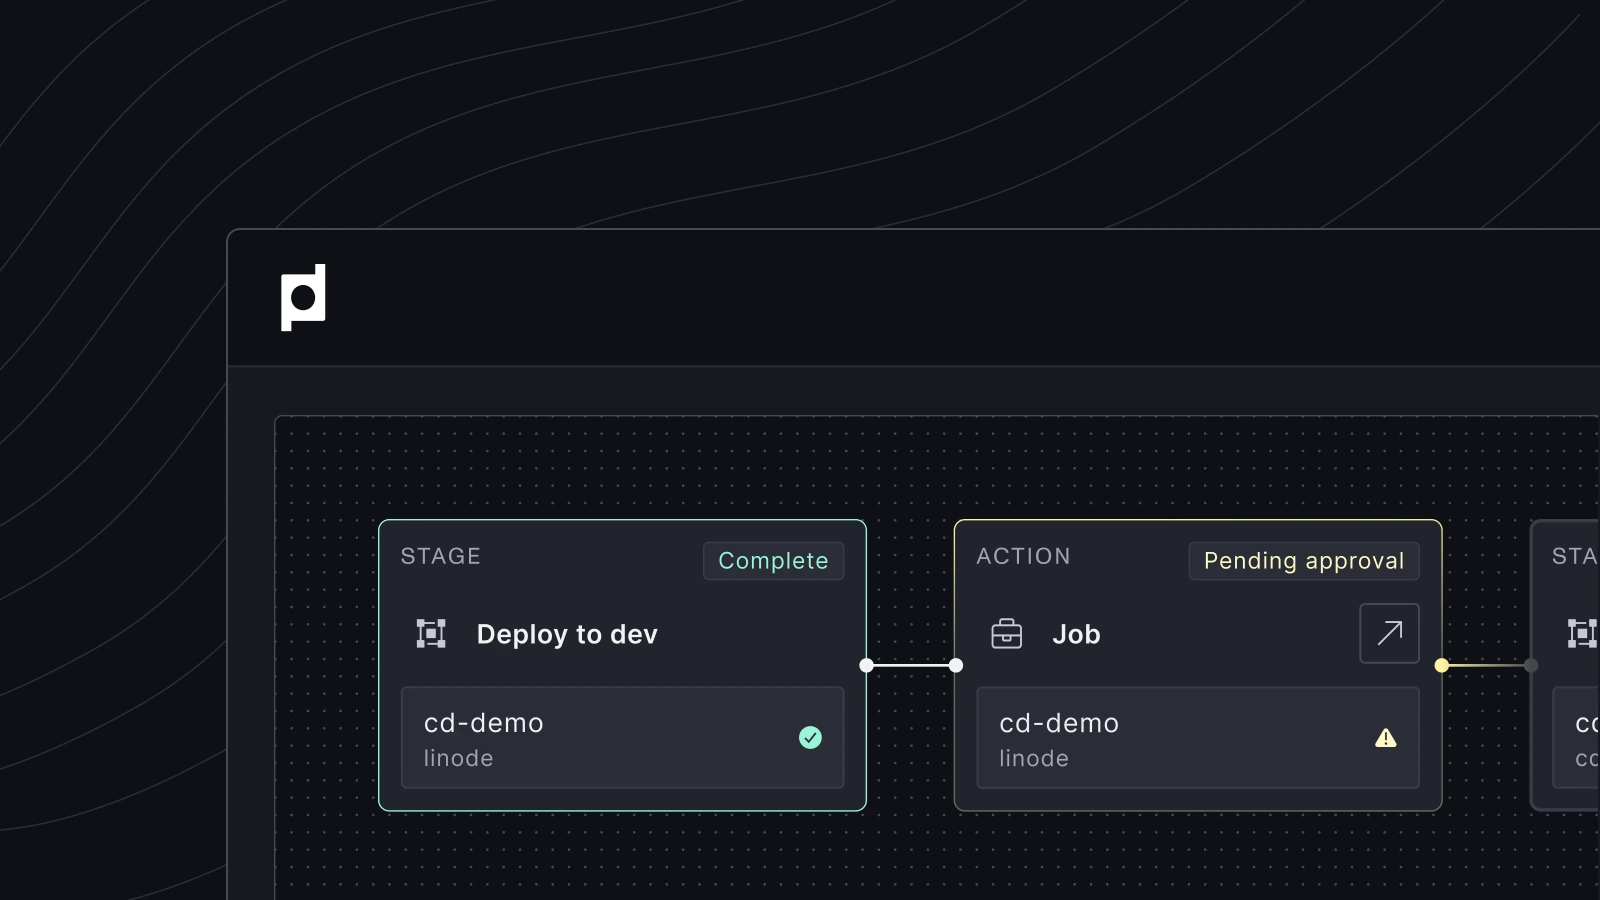
Plural offers a unified Operations Console that monitors your entire environment efficiently. From clusters and workloads to resources, Plural provides real-time visibility into health, status, and usage metrics, all in one place. Its intuitive interface ensures you can maintain control and consistency across your clusters, simplifying operations at scale. Instead of jumping between different tools and dashboards, you have a single pane of glass to observe and manage everything.
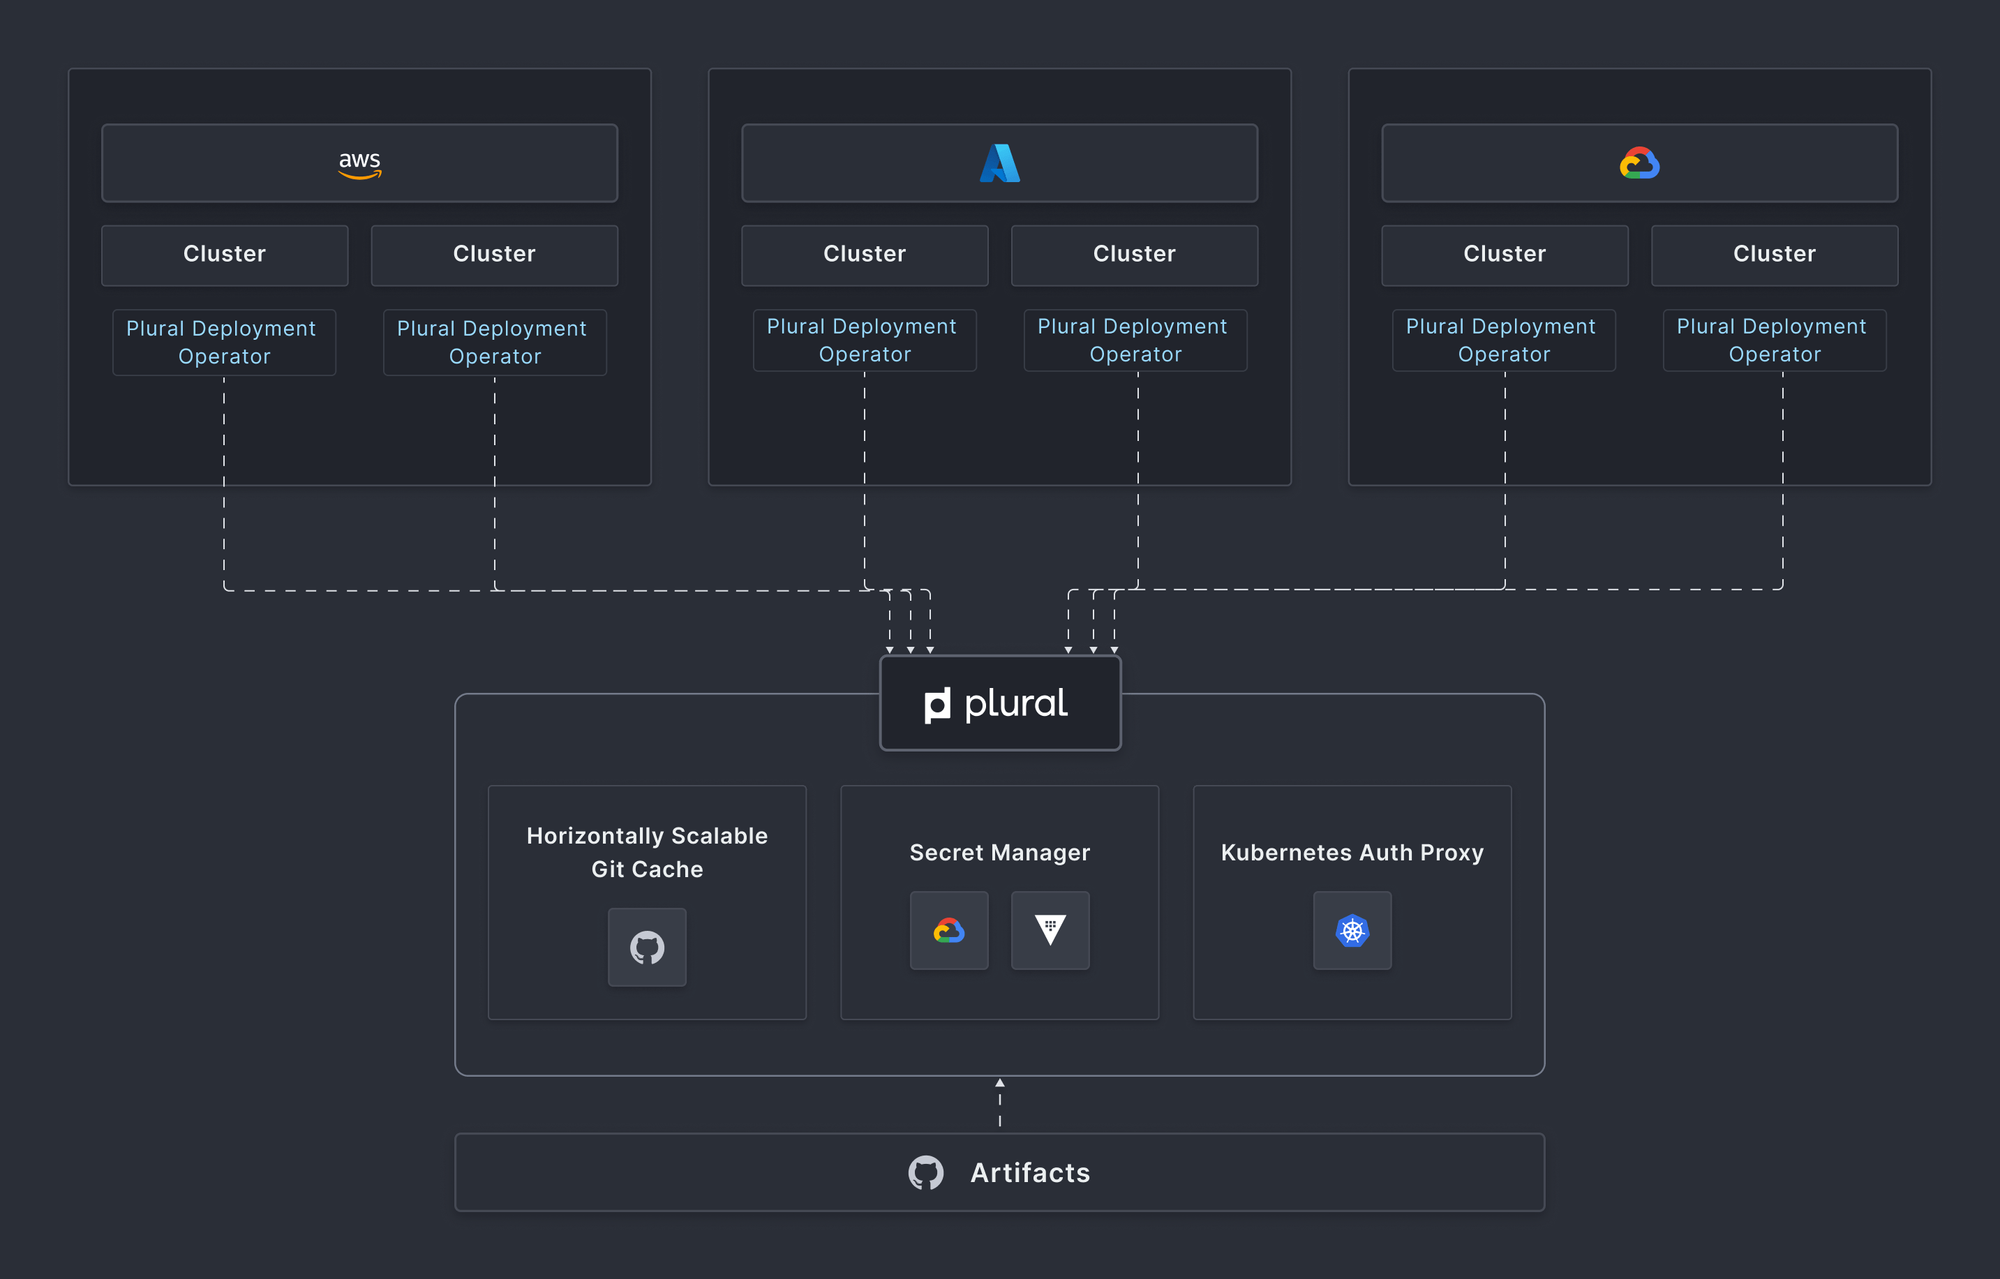
Agent-based Architecture
Plural simplifies the management of Prometheus and Grafana across your entire Kubernetes fleet. With Plural's agent-based architecture, deploying and configuring these monitoring tools is streamlined. You define the desired monitoring setup once, and Plural handles the deployment and configuration across all your clusters, ensuring consistency and reducing operational overhead.
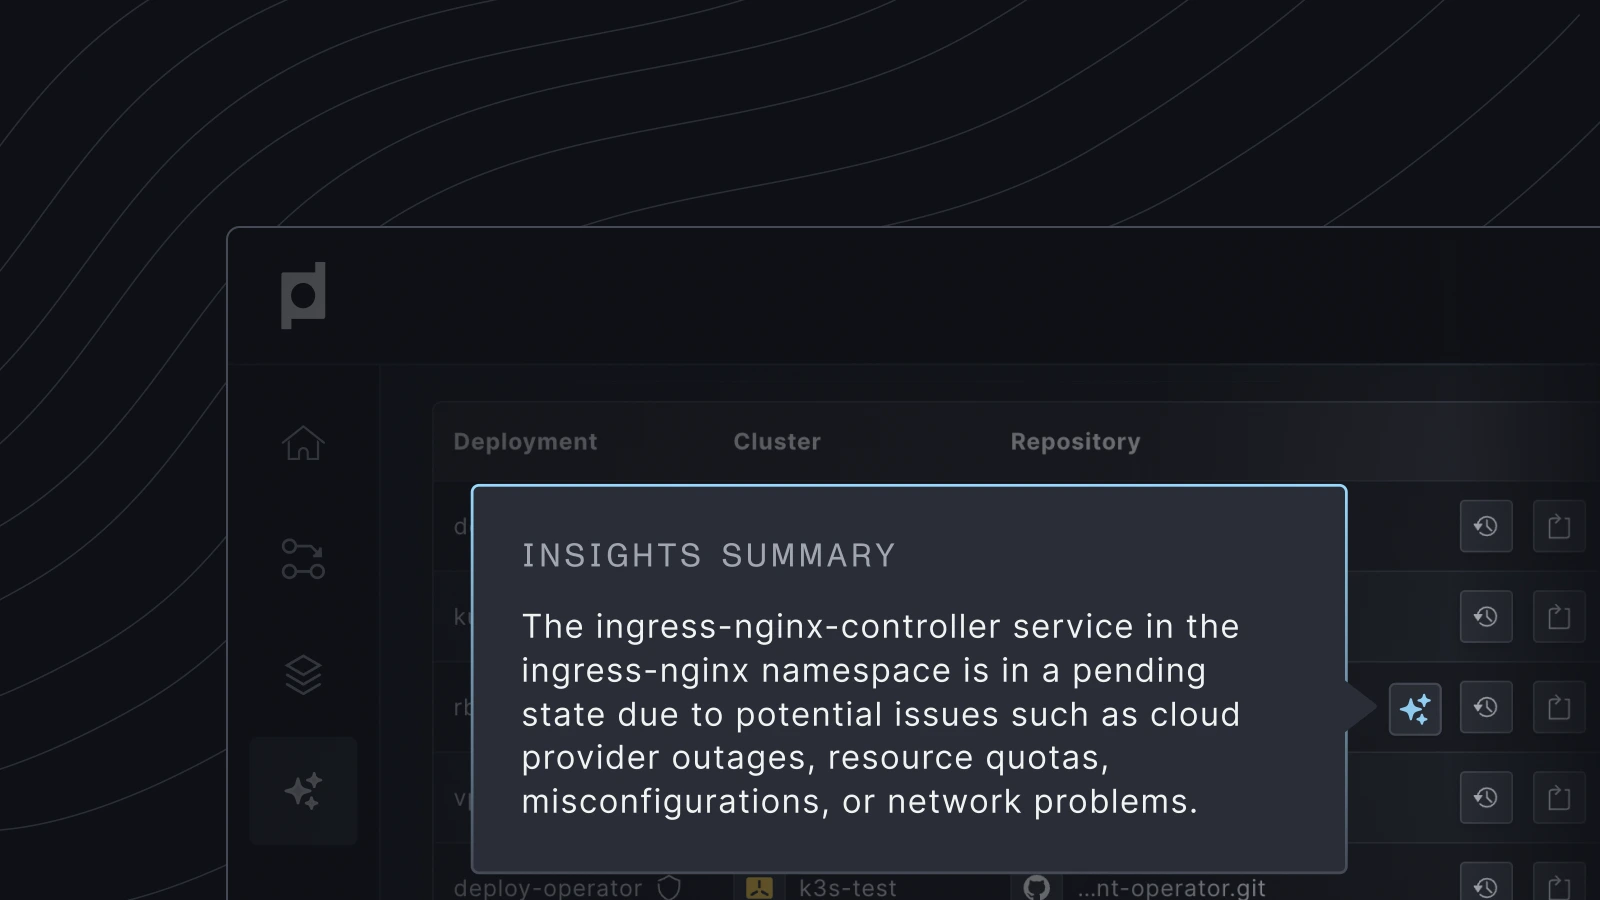
AI-driven Insights
Beyond just observation, Plural facilitates troubleshooting. Plural's AI-driven Insights uniquely combine real-time code and infrastructure telemetry, enabling Kubernetes users to easily and automatically identify, diagnose, and resolve complex issues across clusters. By correlating metrics with deployments and configurations, Plural helps pinpoint the root cause of problems faster. Imagine a scenario where a deployment starts experiencing increased latency. With Plural, you can quickly correlate this latency spike with recent deployments, configuration changes, or resource usage patterns, drastically reducing the time it takes to identify and resolve the deployment problem.
Integrating Monitoring with CI/CD
Monitoring shouldn't stop at deployment. Integrate your monitoring tools into your CI/CD pipeline. This allows you to track application performance and infrastructure health throughout the entire deployment process.
Plural's self-service automation significantly reduces the risks associated with deployments, maintenance, and upgrades by combining automated workflows with the flexibility of built-in Helm charts. Plural streamlines complex configurations and ensures consistent deployments across clusters. Minimize the chance of errors or downtime during updates.
Related Articles
- How to Monitor a Kubernetes Cluster: The Ultimate Guide
- Kubernetes Monitoring: The Ultimate Guide (2024)
Unified Cloud Orchestration for Kubernetes
Manage Kubernetes at scale through a single, enterprise-ready platform.
Frequently Asked Questions
How does Grafana enhance Kubernetes monitoring? Grafana transforms raw Kubernetes metrics into insightful, real-time visualizations, enabling quicker identification of performance bottlenecks and resource constraints. It provides a centralized platform to monitor everything from cluster-level resource usage to individual container performance.
What are the steps to install Grafana on my Kubernetes cluster? You can install Grafana using Helm. After ensuring your cluster is running and adding the Grafana Helm repository, you create a namespace (optional but recommended) and install the chart with a simple Helm command. A Persistent Volume Claim for storage, a Deployment for managing pods, and a Service for exposing Grafana are typically involved.
How do I set up data sources and create dashboards in Grafana for Kubernetes? Grafana supports various data sources like Prometheus, which is commonly used with Kubernetes. You can configure these using YAML files. Grafana also offers pre-built dashboards and curated templates for Kubernetes, simplifying the setup and providing key metrics visualizations.
How can I secure my Grafana instance within Kubernetes? Change the default admin credentials immediately after installation. Implement robust authentication and authorization using methods like OAuth or your identity provider. Isolating Grafana in a dedicated namespace and using network policies further enhances security by restricting access.
What are some advanced Grafana techniques for optimizing Kubernetes monitoring? For large clusters, optimize Prometheus queries using PromQL features to reduce data load. Grafana supports monitoring multiple clusters through federated data sources. You can also integrate machine learning capabilities for anomaly detection and resource forecasting.

Newsletter
Join the newsletter to receive the latest updates in your inbox.


