
Effective Kubernetes Monitoring: Tools & Strategies
Learn essential tools and strategies for effective Kubernetes monitoring to ensure optimal performance and reliability in your containerized environments.
Running applications on Kubernetes? Then you know that keeping track of everything can be a challenge. From resource constraints and application latency to security vulnerabilities and network bottlenecks, the dynamic nature of Kubernetes demands constant vigilance. Effective Kubernetes monitoring is no longer a luxury; it's a necessity.
This guide provides a deep dive into the world of Kubernetes monitoring, exploring the key metrics you need to track, the challenges you'll face, and recommended best practices. We'll also explore the evolving landscape of Kubernetes monitoring tools and technologies. For teams managing multiple clusters and complex Kubernetes environments at scale, we'll explore how Plural streamlines operations by consolidating resource monitoring, log viewing, and management functions into a unified interface.
Unified Cloud Orchestration for Kubernetes
Manage Kubernetes at scale through a single, enterprise-ready platform.
Key Takeaways
- Comprehensive monitoring is key for Kubernetes success: Track key metrics from cluster, node, pod, and application layers to understand resource utilization, application performance, and overall health. Proactive monitoring allows for early problem identification, optimized resource allocation, and improved application resilience.
- Select the right tools and address Kubernetes-specific challenges: The dynamic nature of Kubernetes requires monitoring solutions that can handle distributed systems, high data volumes, and constant change. Choose tools that integrate seamlessly with your Kubernetes environment and provide actionable insights.
- Monitor a large-scale Kubernetes cluster with Plural: While open-source tools like Prometheus and Grafana provide a solid foundation for Kubernetes monitoring, managing them at scale quickly adds complexity. Plural integrates these tools and enhances them with features designed for managing and monitoring large-scale Kubernetes deployments.
What is Kubernetes Monitoring and Why Does It Matter?
Kubernetes has become the de facto standard for orchestrating containerized applications, simplifying deployment and scaling. But the dynamic and distributed nature of Kubernetes introduces complexity. Understanding the state of your clusters, applications, and infrastructure becomes crucial for maintaining performance and reliability. This is where Kubernetes monitoring comes in.
What is Kubernetes Monitoring?
Kubernetes monitoring provides a comprehensive view of the health and performance of your entire Kubernetes environment. It's more than just checking if things are up and running; it's about collecting and analyzing metrics from various layers of your infrastructure—from the underlying nodes and pods to the applications running within them. Effective monitoring gives you insights into resource utilization (CPU, memory, storage), application performance, and the overall health of the Kubernetes control plane.
Benefits of Monitoring Complex Environments
Monitoring is essential for several reasons in complex environments like Kubernetes. First, it enables proactive problem identification. By tracking key metrics and setting up alerts, you can catch issues before they impact users. Second, monitoring helps optimize resource utilization. By understanding how your applications consume resources, you can identify areas for improvement and reduce costs. Finally, robust monitoring is crucial for assessing application resilience. Without Kubernetes-specific monitoring, you lack the visibility to understand how your applications perform under stress and identify potential weaknesses.
Key Kubernetes Metrics
Understanding these metrics provides insights into your cluster's health, performance, and resource utilization.
Cluster Metrics
Cluster-level metrics offer a high-level view of overall resource consumption and operational status. Key metrics to monitor include CPU usage, memory usage, and disk usage. Tracking these metrics helps identify resource bottlenecks and potential capacity issues. For stateful applications, disk usage becomes particularly critical as persistent data consumes storage space. Monitoring cluster resource utilization allows you to anticipate resource constraints and scale your cluster accordingly. Observing trends in cluster-wide resource usage can also inform capacity planning and prevent future resource shortages.
Node and Pod Metrics
Drilling down from the cluster level, node and pod metrics provide granular insights into individual resource usage. For each node, monitor CPU, memory, and disk utilization. Similarly, track these metrics for individual pods. Additionally, monitoring pod state (Running, Pending, Failed) helps understand pod behavior and correlate it with resource metrics. Pod-level metrics are essential for identifying performance bottlenecks and optimizing resource allocation within your cluster. This granular data lets you pinpoint specific nodes or pods experiencing resource constraints and take corrective action.
Application Metrics
While monitoring application performance within the pods is essential, it's equally crucial to understand how Kubernetes itself impacts application behavior. Network issues stemming from kube-proxy or scheduling problems due to unresponsive nodes can significantly affect application resilience. Therefore, monitoring Kubernetes-specific metrics, such as API server latency and etcd performance, is essential. This holistic approach ensures you can pinpoint whether performance issues originate from the application or the underlying Kubernetes infrastructure.
Network and Storage Metrics
Network and storage performance are fundamental to the stability and responsiveness of your applications. Key network metrics include network throughput, latency, and error rates. Monitoring these metrics helps identify network bottlenecks and connectivity issues.
For storage, focus on metrics like I/O operations per second (IOPS), throughput, and latency. Especially for stateful applications, storage performance directly impacts application responsiveness. Analyzing these metrics helps ensure your underlying infrastructure can support the demands of your applications.
Kubernetes Monitoring Challenges
Monitoring Kubernetes effectively presents unique challenges due to its dynamic and distributed nature. Understanding these challenges is the first step towards building a robust monitoring strategy.
Distributed Systems Complexity
Kubernetes introduces a significant layer of complexity compared to traditional monolithic applications. Instead of monitoring a single application, you're now dealing with a distributed system composed of numerous interconnected services running across multiple nodes. This distributed architecture makes pinpointing the root cause of issues more difficult.
Data Volume and Scalability
The sheer volume of data generated by a Kubernetes cluster can be overwhelming. Every container, pod, service, and node produces logs, metrics, and events. The challenge lies not just in collecting this data, but also in correlating it to gain meaningful insights. You need to correlate that metric with other data points, such as container resource usage and application logs, to identify the root cause.

Dynamic Container Environments
Kubernetes environments are inherently dynamic. Pods are created and destroyed, nodes join and leave the cluster, and deployments are constantly updated. This constant state of flux makes traditional monitoring approaches, which often rely on static configurations, ineffective. You need a monitoring system that can adapt to these changes and provide accurate insights into the health and performance of your applications and infrastructure.
Tooling and Integration
Kubernetes doesn't offer a single, built-in monitoring solution. You must select and integrate a separate monitoring system. This involves choosing the right tools for metrics collection, storage, visualization, and alerting, and configuring them to work seamlessly with your Kubernetes cluster. This can be a complex undertaking, requiring careful planning and execution.
Effective Kubernetes Monitoring Best Practices
Effective Kubernetes monitoring is crucial for maintaining the health, performance, and security of your applications. It's not just about collecting metrics; it's about using those metrics to understand your system's behavior and proactively address potential issues.
Build a Comprehensive Monitoring Strategy
Kubernetes monitoring involves tracking the health and performance of all components within your Kubernetes environment. This includes the Kubernetes control plane, worker nodes, pods, and the applications running within those pods. A comprehensive monitoring strategy should combine Kubernetes data with application-specific metrics to provide a holistic view of your system. This allows you to pinpoint problems quickly and understand how different components interact.
Set Up Proactive Alerting
Don't wait for problems to escalate before taking action. Set up proactive alerts based on pre-defined thresholds for critical metrics. For instance, you could configure alerts for high CPU usage, memory exhaustion, pod restarts, or network saturation. These alerts should notify your team immediately so they can investigate and resolve issues before they impact users.
Use Visualizations and Dashboards
Raw metrics are valuable, but visualizations make them much easier to interpret. Use dashboards to visualize key metrics and trends over time. Tools like Grafana provide pre-built dashboards and allow you to create custom visualizations tailored to your specific needs. Visualizing data helps you identify patterns, spot anomalies, and understand the overall health of your Kubernetes environment at a glance.

Correlate Data Across Components
In a complex Kubernetes environment, issues often span multiple components. To effectively troubleshoot problems, you need to correlate data across different parts of your system. For example, if you see increased latency in your application, you can correlate that with metrics from your ingress controller, service mesh, and underlying pods to pinpoint the root cause.
Automate Monitoring
Manual monitoring is time-consuming and inefficient. Automate as much of your monitoring as possible. This includes automating the deployment of monitoring agents, the collection of metrics, and generating alerts. Automation frees your team to focus on more strategic tasks and ensures consistent monitoring practices across your Kubernetes deployments. For example, you could use a configuration management tool like Ansible or Terraform to automatically deploy Prometheus and Grafana to new clusters, ensuring consistent monitoring across your infrastructure.

Kubernetes Monitoring Tools and Technologies
Choosing the right monitoring tools is crucial for effective Kubernetes management. The diverse ecosystem offers various open-source, cloud-native, and third-party solutions, each with strengths and weaknesses.
Open-Source Tools: Prometheus, Grafana, cAdvisor
The open-source community provides a robust foundation for Kubernetes monitoring. A typical combination includes Prometheus, Grafana, and cAdvisor.
- Prometheus, a popular time-series database, excels at collecting and querying multi-dimensional metrics using its PromQL language. While powerful, Prometheus can present scalability challenges as your infrastructure grows.
- Grafana complements Prometheus by transforming the collected metrics into insightful visualizations and dashboards. While Grafana shines in dashboarding, it's not optimized for log management.
- cAdvisor, a built-in Kubernetes agent, offers basic container resource usage data. cAdvisor's simplicity is countered by its limited analytical capabilities.

Cloud-Native Monitoring Services
Cloud providers offer integrated monitoring services tailored to their respective Kubernetes offerings. These services simplify setup and integration, often providing pre-built dashboards and alerts. For instance, Grafana Cloud builds upon the open-source Grafana project, offering a managed service with enhanced features and scalability. This allows for streamlined Kubernetes monitoring with pre-configured dashboards and alerts, simplifying visualization and troubleshooting.
Third-Party Monitoring Platforms
Third-party platforms offer comprehensive monitoring solutions that extend beyond basic metrics. These platforms often integrate various data sources, including logs, metrics, and traces, into a unified view. For example, solutions such as Datadog and Elastic provide a robust monitoring solution that combines these data types, facilitating a holistic understanding of your Kubernetes environment. Such platforms offer advanced features and integrations, catering to organizations with complex monitoring requirements.
Compare Tool Functionality
Selecting the right tools depends on your specific needs and priorities. Open-source tools offer flexibility and cost-effectiveness but may require more manual configuration and maintenance. Cloud-native services provide convenience and integration, but can lock you into a specific provider. Third-party platforms offer comprehensive features and support but often have a higher price tag. Consider factors like scalability, ease of use, integration with existing systems, and the level of support required when evaluating different options.
Large-scale Kubernetes Monitoring with Plural
While open-source tools like Prometheus and Grafana provide a solid foundation for Kubernetes monitoring, managing them at scale across a fleet of Kubernetes clusters quickly adds complexity. Kubernetes monitoring isn't a one-size-fits-all solution. To get a complete picture of your environment, you need to understand the multiple levels of your infrastructure—from individual containers to the nodes and the cluster as a whole.
This is where a Kubernetes management platform like Plural shines. Plural integrates these tools and enhances them with features designed for managing and monitoring large-scale Kubernetes deployments.
Unified Kubernetes Dashboard
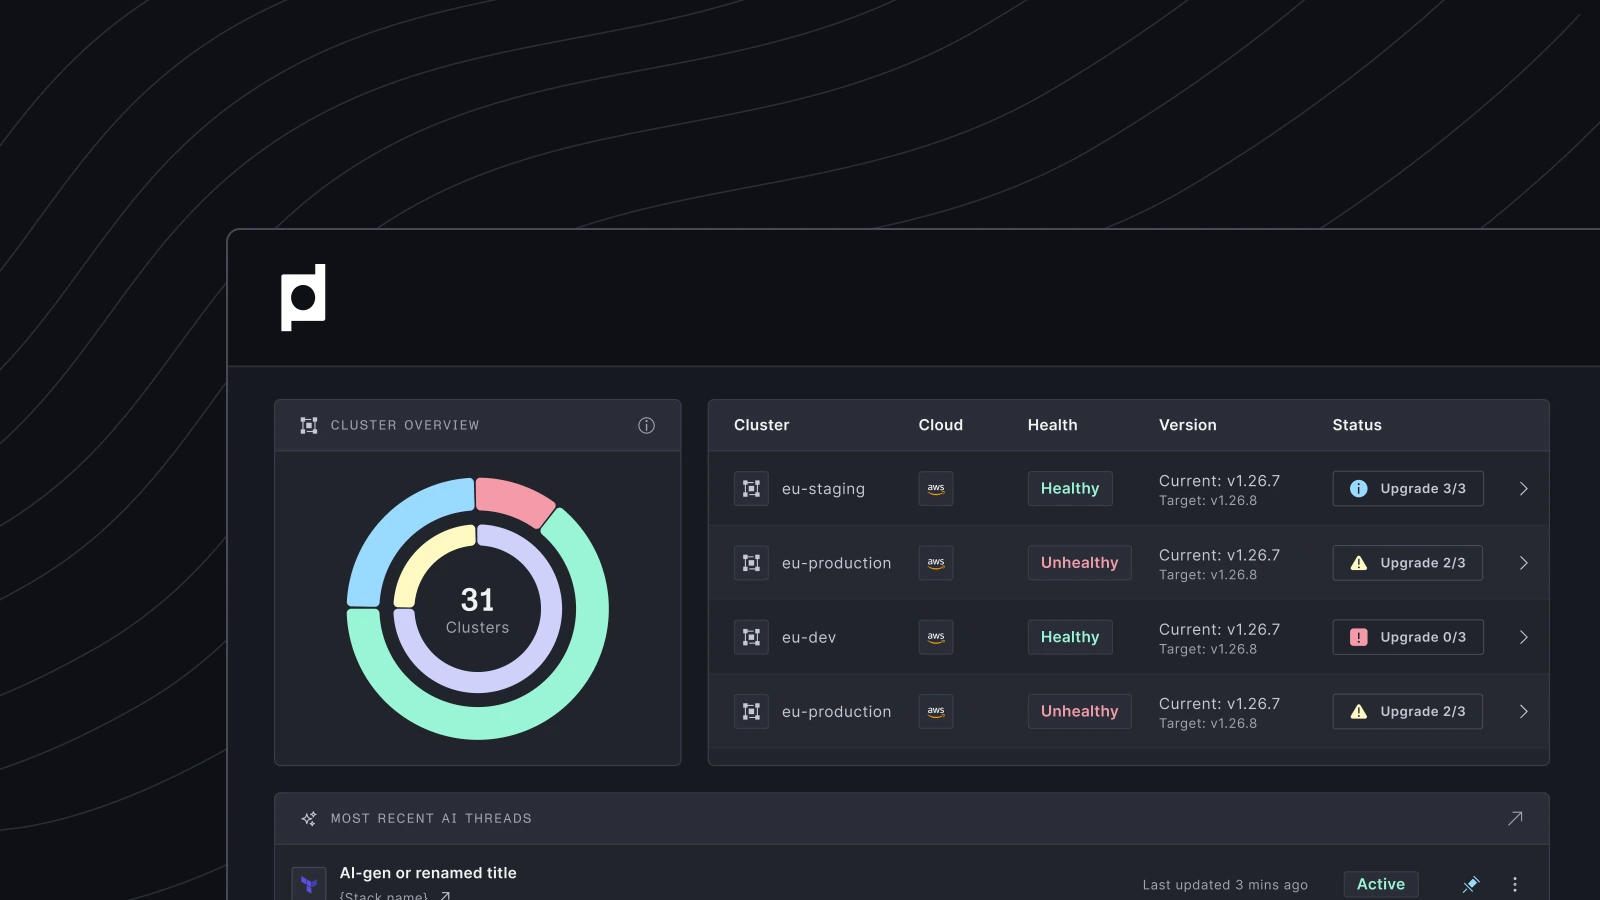
Plural offers a unified Operations Console that monitors your entire environment efficiently. From clusters and workloads to resources, Plural provides real-time visibility into health, status, and usage metrics, all in one place. Instead of jumping between different tools and dashboards, you have a single pane of glass to observe and manage everything.
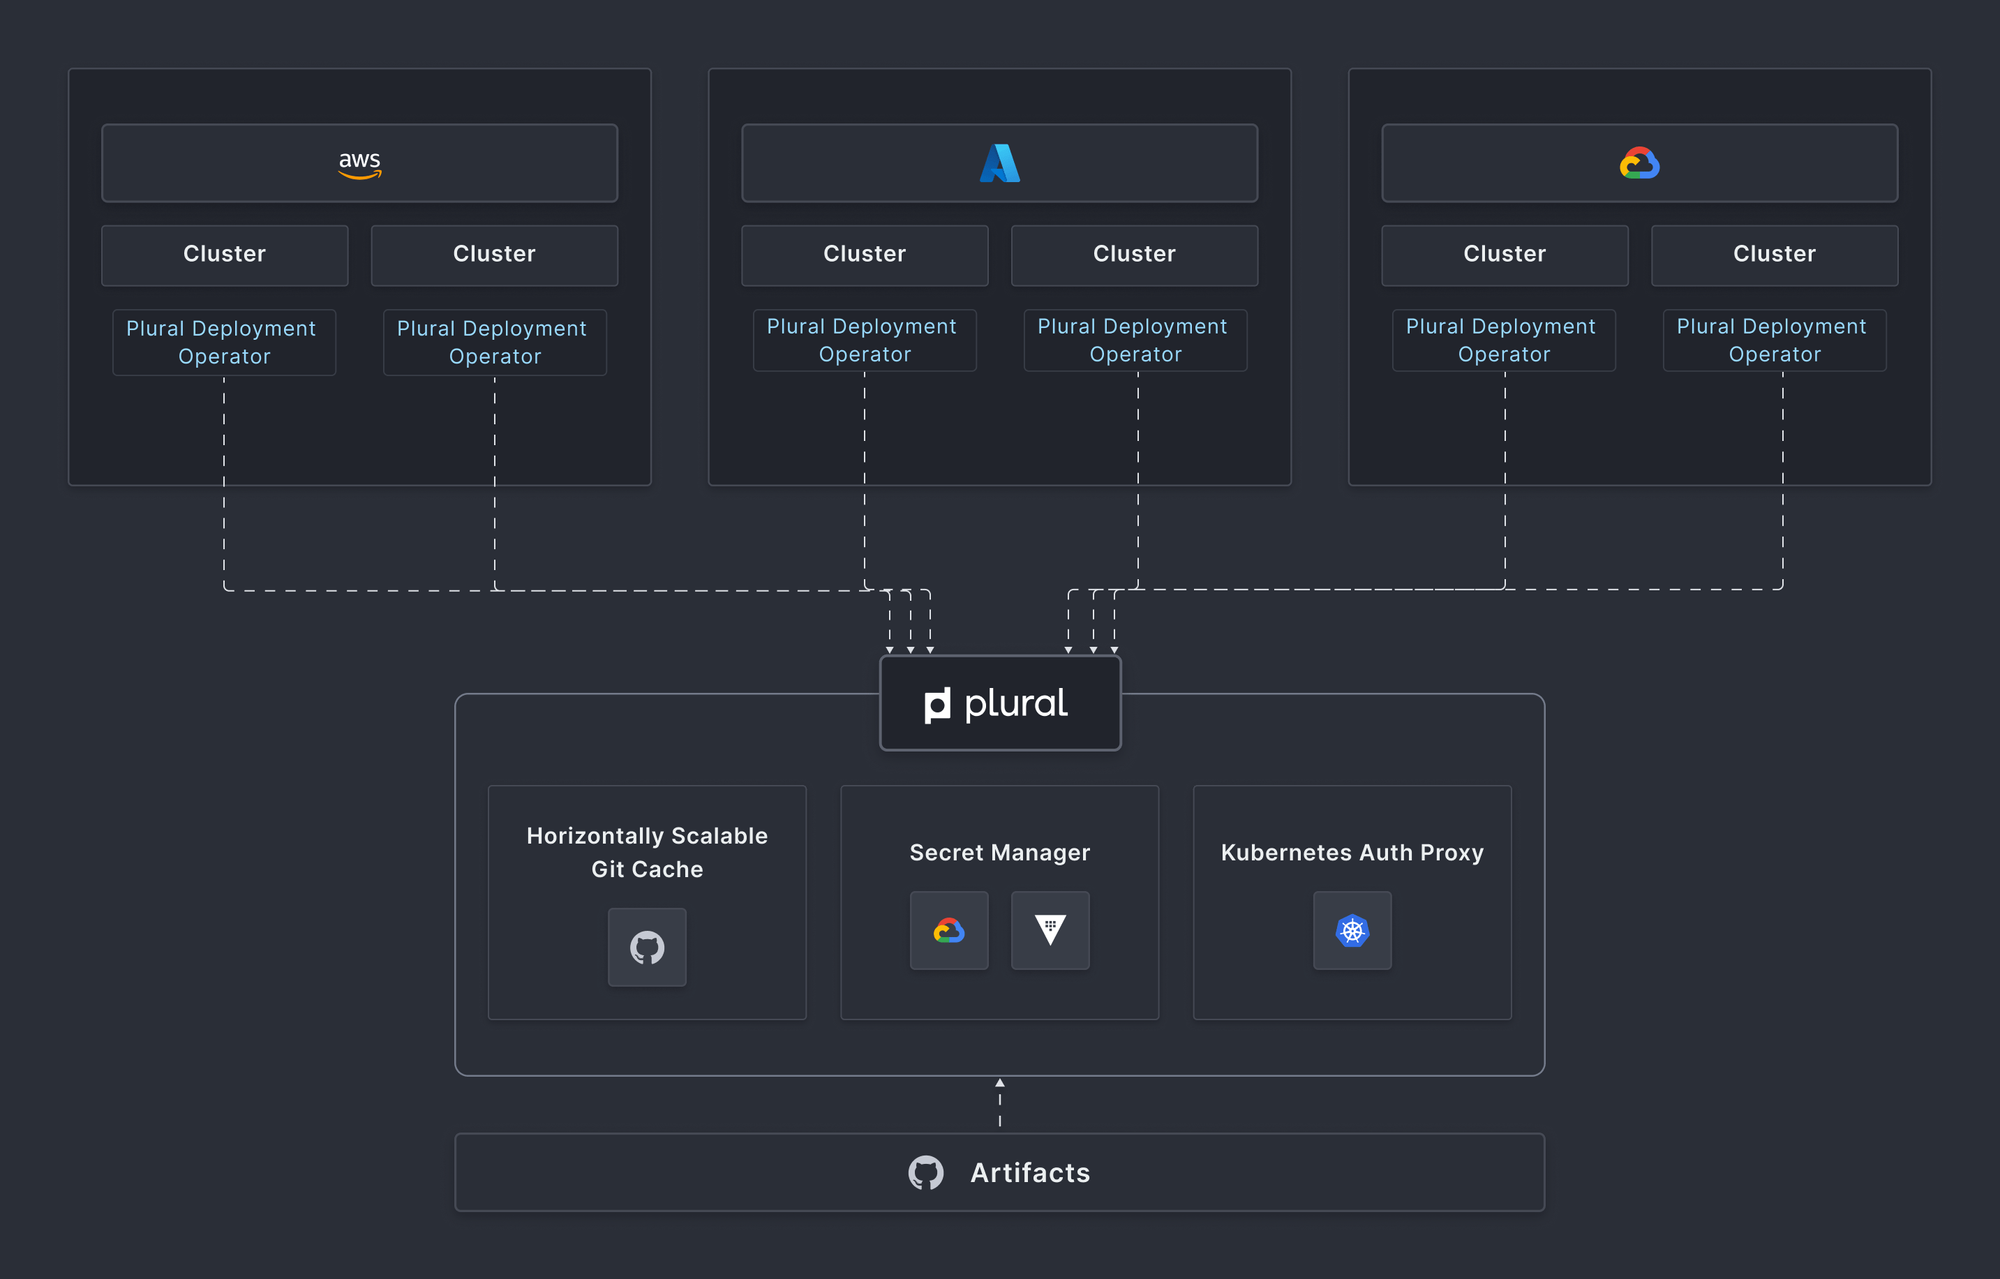
Agent-based Architecture
Plural simplifies the management of Prometheus and Grafana across your entire Kubernetes fleet. With Plural's agent-based architecture, deploying and configuring these monitoring tools is streamlined. You define the desired monitoring setup once, and Plural handles the deployment and configuration across all your clusters, ensuring consistency and reducing operational overhead.
AI-driven Insights
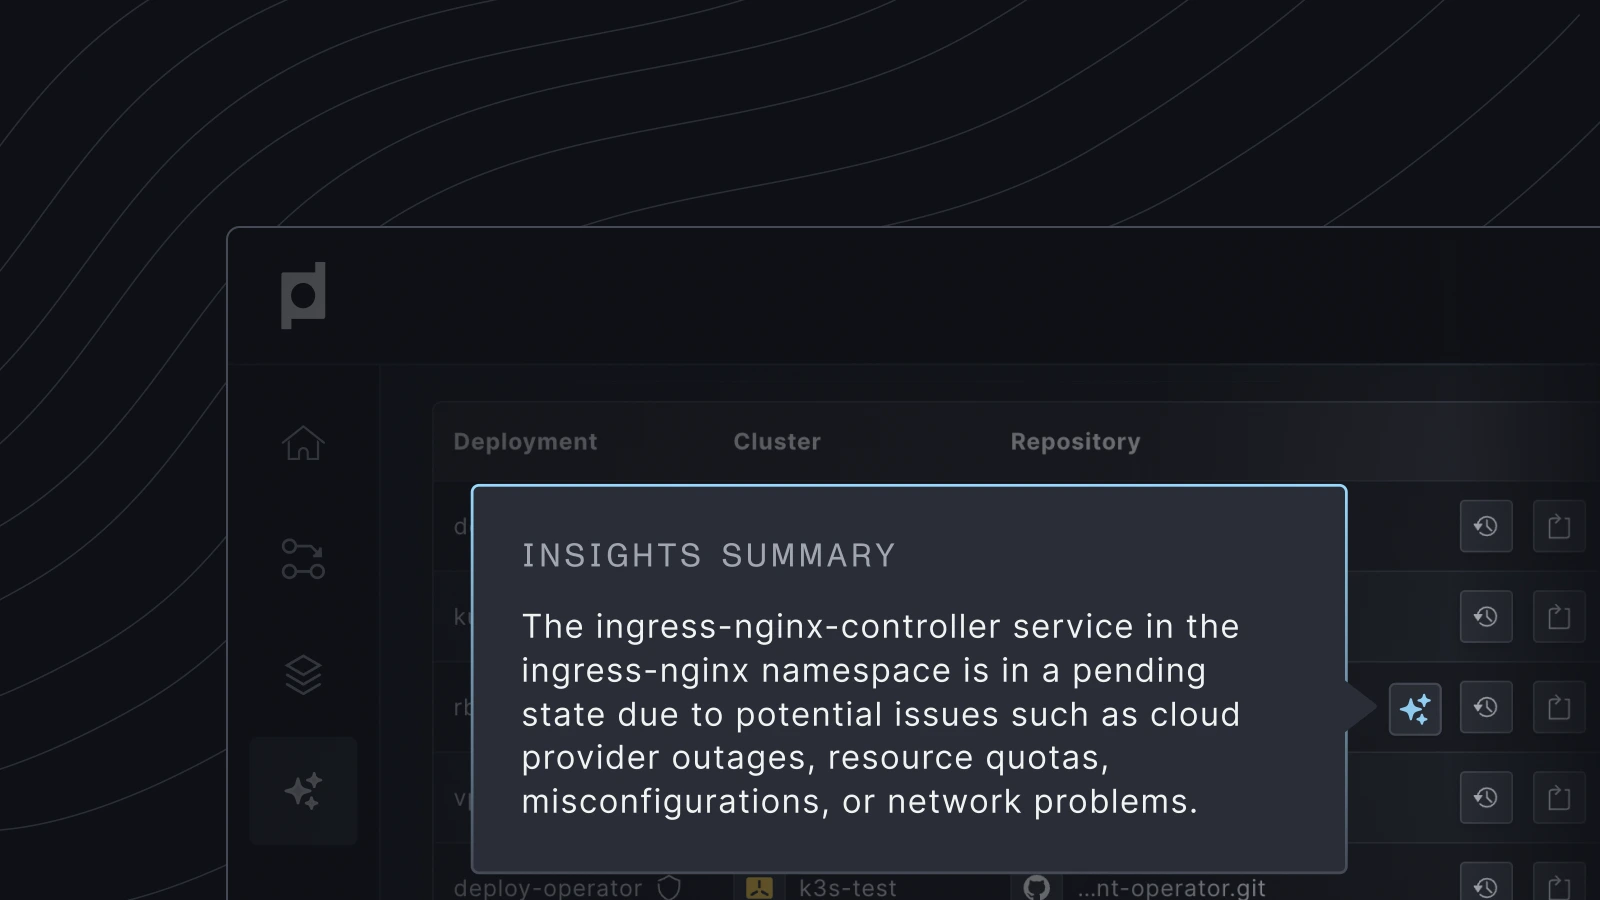
Beyond just observation, Plural facilitates troubleshooting. Plural's AI-driven Insights uniquely combine real-time code and infrastructure telemetry, enabling Kubernetes users to easily and automatically identify, diagnose, and resolve complex issues across clusters. By correlating metrics with deployments and configurations, Plural helps pinpoint the root cause of problems faster.
Related Articles
Unified Cloud Orchestration for Kubernetes
Manage Kubernetes at scale through a single, enterprise-ready platform.
Frequently Asked Questions
Why is monitoring important for Kubernetes?
Kubernetes's dynamic nature makes it complex. Monitoring provides insights into the health and performance of your applications and infrastructure, enabling proactive problem identification and resource optimization. Without it, you're flying blind, risking downtime and inefficient resource use.
What are the key metrics to monitor in Kubernetes?
Focus on cluster-level metrics (CPU, memory, disk), node and pod metrics (same as cluster, plus pod state), and application metrics (latency, error rates, and Kubernetes-specific metrics like API server latency). Don't forget the performance of the network (throughput, latency, errors) and storage (IOPS, throughput, latency). Each provides a different layer of insight into your system's health.
What are the challenges in monitoring Kubernetes?
Kubernetes's distributed nature makes pinpointing issues harder than with traditional apps. The sheer volume of data generated can overwhelm systems. The dynamic environment requires adaptable monitoring with constantly changing pods and nodes. Finally, choosing and integrating the right tools from the diverse ecosystem can be complex.
What are some best practices for Kubernetes monitoring?
Develop a comprehensive strategy covering all components. Set up proactive alerts for critical metrics. Visualize data with dashboards. Correlate data across components to troubleshoot effectively. Automate monitoring tasks like agent deployment and alert generation. These practices ensure efficient and effective monitoring.
What tools are available for Kubernetes monitoring?
Open-source options like Prometheus, Grafana, and cAdvisor are a good starting point. Cloud providers offer integrated services, simplifying setup. Third-party platforms provide comprehensive solutions but often come at a higher cost. The best choice depends on your specific needs and resources. Usually, a combination of tools is the most effective approach.

Newsletter
Join the newsletter to receive the latest updates in your inbox.


